| Species | Bill Length (mm) | Bill Depth (mm) | Flipper Length (mm) | Body Mass (g) | |
|---|---|---|---|---|---|
| 0 | Adelie | 38.8 | 18.3 | 190.0 | 3700.7 |
| 1 | Chinstrap | 48.8 | 18.4 | 195.8 | 3733.1 |
| 2 | Gentoo | 47.5 | 15.0 | 217.2 | 5076.0 |
Replication Example: Python + Quarto
6.1 Why Python + Quarto?
Python is a flexible, powerful language for data analysis, and Quarto lets you combine code, text, and outputs in a single, reproducible document. This is ideal for replication: your analysis, results, and explanations are all in one place and can be re-run with a single command.
Advantages: - All-in-one: Combine code, results, and narrative. - Reproducible: Anyone can re-run the entire analysis and get the same results. - Transparent: Every step is documented and visible. - Flexible: Mix Python with R, Julia, or bash if needed.
6.2 Project Setup and Best Practices
As with Stata, follow a clear folder structure (see Folder organization).
Keep original data in data/original/ and never modify it.
Save processed data in data/temporary/ if needed.
- Document your Python version and Quarto version, including dependencies like
pandasorstatsmodels, in the README.- It is also possible to pin your dependencies using tools like
poetryand python environments. We are not explaining it here, though.
- It is also possible to pin your dependencies using tools like
If your analysis is slow or computationally intensive:
- Use Quarto code chunk options like
eval: falseto skip running heavy code when updating text. More on this later. - You can cache results with Quarto’s chunk caching (
cache: true), but always provide code to regenerate everything from scratch. - If you must include pre-computed intermediate data, explain this in the README and allow users to re-run the full analysis if desired.
Note
You can export tables and figures from Python (e.g., as .tex or .png) and include them in your LaTeX manuscript. With Quarto, you can also render the entire document to PDF or HTML, ensuring all results are up-to-date and reproducible.
6.3 Example: Fully Reproducible Analysis in Quarto
Below is a minimal example of a Quarto document for a replication package.
This workflow loads data, cleans it, runs regressions, and exports a LaTeX table—all in one go. We use data from a public URL for demonstration.
When writing the code, you can always check it on a console before integrating it in your Quarto document.
---
title: "Replication Example: Python + Quarto"
---
```{python}
#| echo: false
import pandas as pd
#import statsmodels.api as sm
# Data URLS
data_url = 'https://raw.githubusercontent.com/allisonhorst/palmerpenguins/refs/heads/main/inst/extdata/penguins.csv'
df = pd.read_csv(data_url)
# Create a summary grouping by species
grouped_data = df.groupby('species').agg({
'bill_length_mm': 'mean',
'bill_depth_mm': 'mean',
'flipper_length_mm': 'mean',
'body_mass_g': 'mean'
}).reset_index().round(1).rename(columns = {
'species' : 'Species',
'bill_length_mm': 'Bill Length (mm)',
'bill_depth_mm': 'Bill Depth (mm)',
'flipper_length_mm': 'Flipper Length (mm)',
'body_mass_g': 'Body Mass (g)'
})
```
The data contains measurements of penguin species, including bill length, bill depth, flipper length, and body mass.
@tbl-summary provides summary statistics for these measurements by species.
```{python}
#| echo: false
#| tbl-cap: Summary statistics by species
#| label: tbl-summary
grouped_data
```
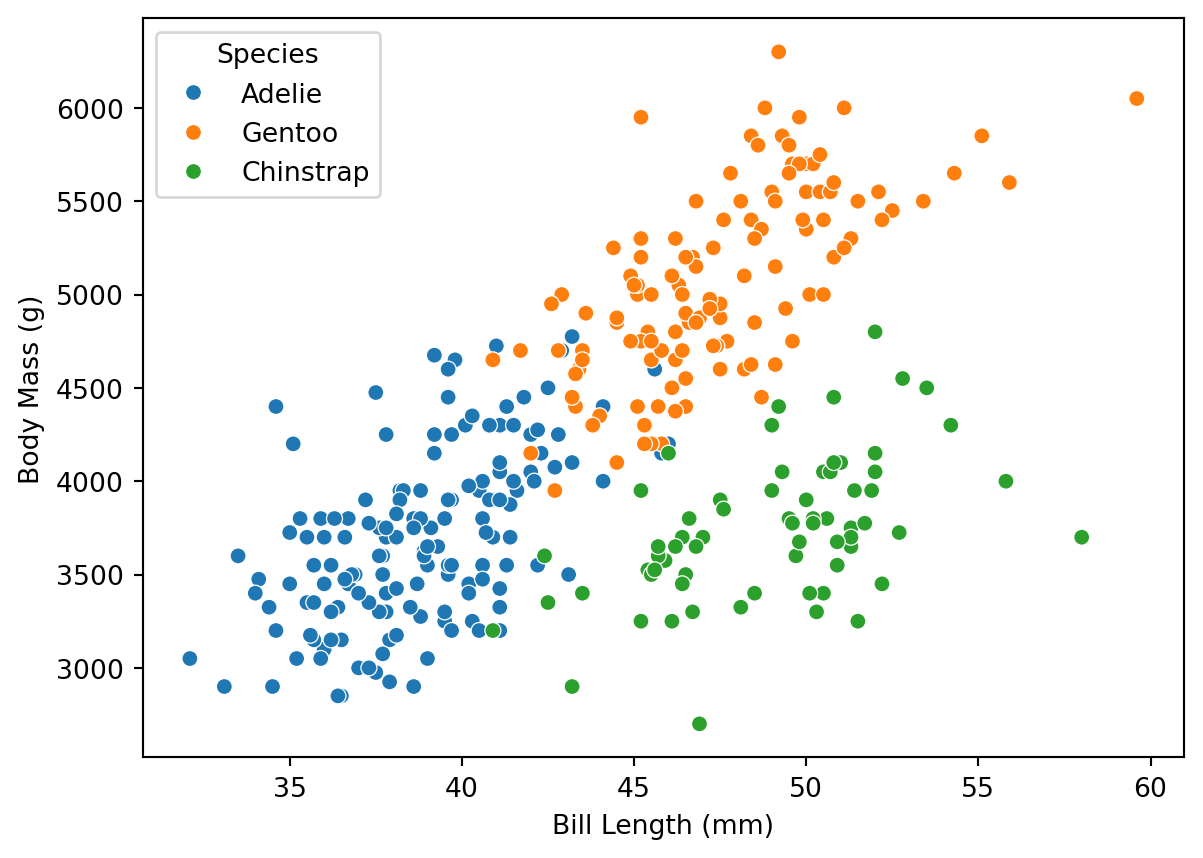
We can also visualize the relationship between bill length and body mass, as depicted in @fig-scatter.
```{python}
#| echo: false
#| fig-cap: Scatter plot of bill length vs. body mass
#| label: fig-scatter
import seaborn as sns
scatter = sns.scatterplot(x='bill_length_mm', y='body_mass_g', data=df, hue='species')
scatter.legend(title='Species')
scatter.xaxis.set_label_text('Bill Length (mm)')
scatter.yaxis.set_label_text('Body Mass (g)')
scatter.plot()
```
Quarto makes it easy to include values retrieved from the data that will update if the data changes or we process it differently.
The average mass of Adelie penguins is `{python} float(round(grouped_data.loc[grouped_data['Species'] == 'Adelie', 'Body Mass (g)'].values[0], 1))`.
We can also use a different method:
```{python}
#| echo: false
average_mass_gentoo = grouped_data.loc[grouped_data['Species'] == 'Gentoo', 'Body Mass (g)'].values[0]
average_mass_gentoo = float(round(average_mass_gentoo, 1))
```
The average mass of Gentoo penguins is `{python} average_mass_gentoo`.This results in the following outputs:
The data contains measurements of penguin species, including bill length, bill depth, flipper length, and body mass. Table 6.1 provides summary statistics for these measurements by species.
We can also visualize the relationship between bill length and body mass, as depicted in Figure 6.1.
Quarto makes it easy to include values retrieved from the data that will update if the data changes or we process it differently. The average mass of Adelie penguins is 3700.7.
We can also use a different method:
The average mass of Gentoo penguins is 5076.0.
6.4 Additional considerations
With Quarto, one can split a document into multiple files and include them as needed. This is useful for organizing a research project, making it easier to manage and update individual components without affecting the entire document. For instance, you could have a file introduction.qmd for the introduction, methods.qmd for the methods section, and so on.
Similarly, you can write your main python (or R, Julia, etc.) code in separate script files and include them in your Quarto document using the include directive (it is common to use a _ prefix for documents that are not meant to be rendered). If you had a python file with:
# _summarize.py
import pandas as pd

world_bank_data = pd.read_csv("https://example.com/world_bank_data.csv")

# Summarize the data
summary = world_bank_data.describe()
summary
Then, you could include it in your Quarto document like this:
---
title: "Data"
---

The summary statistics are as follows:

{{< include _summarize.py >}}
This allows for better organization and modularity in your analysis workflow.